Portfolio of Projects
[revised April 13, 2019]
One motivation for creating this blog was to display a portfolio of projects that I have worked on in the last year or so. I’ll list projects here. The plan is that eventually I will add pages that elaborate each project. I hope that publishing my projects on this site will nudge me to be a bit more systematic as I execute projects.
The Diary of Samuel Pepys
Each morning I read an entry from The Diary of Samuel Pepys at a wonderful site created by Phil Gyford. Pepys kept the diary for about ten years during the 1660’s. Inspired by a post by Julia Silge, I did some simple text processing on the diary. That became the occasion for my first shot at creating a Shiny app. The resulting web page is available here. The code to create this web page is available on a GitHub repository.
I had an opportunity to chat with Julia at the RStudio Conference in Orlando. She gave me some suggestions for some additional things I might do with the diary.
Souvenirs of My Walks

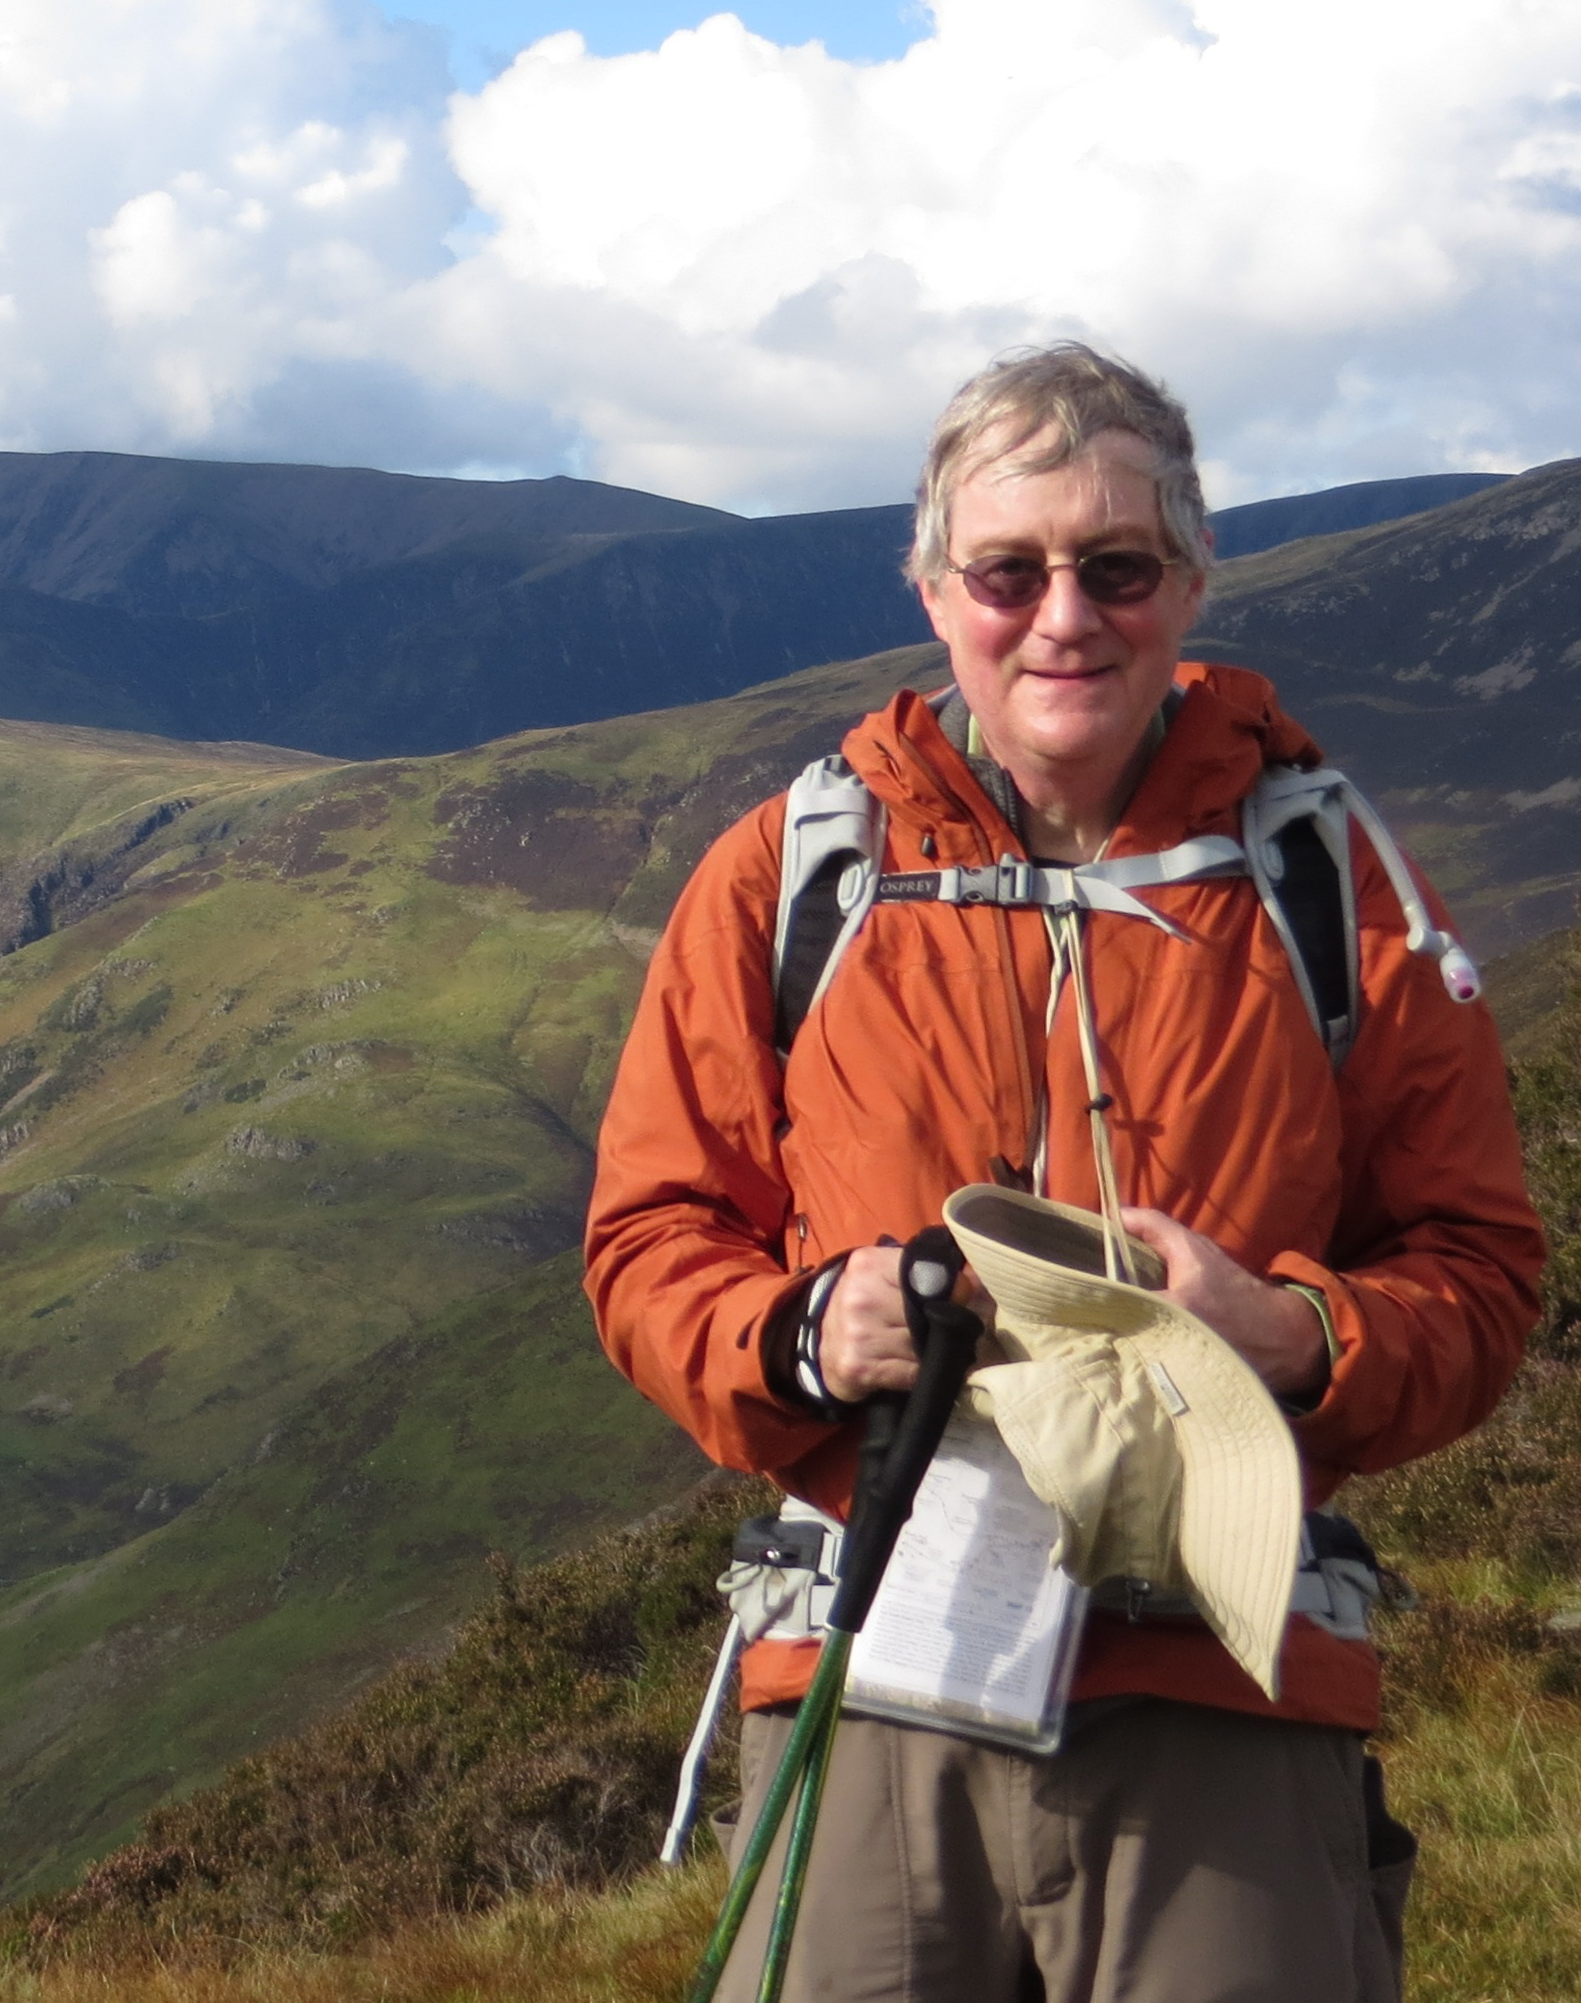
I have always loved to walk. When I retired in 2011 I went on a walking binge. At the same time, I discovered that a GPS trace could be a fun souvenir of my walks. An article I found via R Bloggers led me to try to keep track of my walks more systematically. After doing some research on how to access the Flickr API from R, I was able to display my photos from Flickr on the GPS trace in a Leaflet map. The result is a Shiny app here. I don’t thnk this is of great interest to a stranger, but for me it is a fascinating picture of my walks. I love to zoom in and see the detail of the map combined with the GPS trace and the photos. Like a good souvenir, it triggers lots of memories. If I lingered on a bench additional squiggles appear on the GPS trace showing where I stopped for a spell. I can also see my wrong turns. The code for the sourvenir walks site is available at a GitHub repository. There are also some technical notes and some details on Flickr from R.
Census Data
I used the New Haven area as an example to try to figure out some basic ways to use the American Community Survey (ACS) to look at data for the towns around New Haven. This turned into a nice example using the tidycensus package to fetch data and do some plots in ggplot2.
I did some earlier work with the acs package here which is published on RPubs. It now feels very out of date.
An Implementation of Narcissism in R
Sometimes I just want to play around plotting some data. What data could be more interesting than data about me? It so happens I have a data series of my daily weight spanning more than 20 years. That’s not weird, is it. So I did some charts.
Connecticut Data by Town
I did somse exploring to see what kind of data I could find and then created some maps via ggplot2 to display some of that data. This is very out of date.
Jai Alai
Last but not least is jai alai. Back when I was in graduate school, there were two jai alai frontons in Connecticut, Milford and Bridgeport. Actually at one point there was also a third fronton in Hartford. There are some unique features to the way betting on jai alai is organized that makes it a bit tricky to analyze. Back then that seemed more interesting than working on my dissertaton. That period of my life is long past, but the lure of procrastination is still present. So on serveral occasions I have plunged back into jai alai. Jai alai was one of the first R projects I worked on after I retired. Recently I spent another month of my life on jai alai.